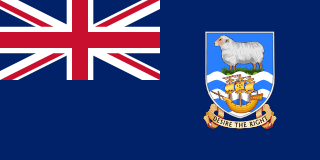
Falkland Islands - Geography

Here, let us take a look at the Geography of Falkland Islands. Deeply indented coast provides good natural harbors; short growing season. Mother's mean age at first birth is (), whereas, the Maternal mortality ratio is
Geographical data of Falkland Islands
| Location | Southern South America, islands in the South Atlantic Ocean, about 500 km east of southern Argentina |
|---|---|
| Geographic coordinates | 51 45 S, 59 00 W |
| Map references | South America |
| Tarrain | rocky, hilly, mountainous with some boggy, undulating plains |
| Natural Resources | fish, squid, wildlife, calcified seaweed, sphagnum moss |
| Natural Hazards | strong winds persist throughout the year |
| Irrigated Land | NA |
| Major rivers (by length in km) | |
| Major aquifers | |
| Land Boundaries | 0 km |
| Border Countries | |
| Coastline | 1,288 km |
| Climate | cold marine; strong westerly winds, cloudy, humid; rain occurs on more than half of days in year; average annual rainfall is 60 cm in Stanley; occasional snow all year, except in January and February, but typically does not accumulate |
| Area | |
| Total Area | |
| Land Area | 12,173 sq km |
| Water Area | 0 sq km |
| comparative Area | slightly smaller than Connecticut |
| Maritime Claims | |
| Territorial sea | 12 nm |
| Continental shelf | 200 nm |
| Exclusive fishing zone | 200 nm |
| Elevations | |
| Highest point | Mount Usborne 705 m |
| Lowest point | Atlantic Ocean 0 m |
| Land Use | |
| Agricultural land | 93.2% (2023 est.) |
| Agricultural land: arable land | arable land: 0% (2022 est.) |
| Agricultural land: permanent crops | permanent crops: 0% (2022 est.) |
| Agricultural land: permanent pasture | permanent pasture: 93.2% (2023 est.) |
| Forest | 0% (2022 est.) |
| Other | 6.8% (2023 est.) |
Population Distribution
A very small population, with most residents living in and around Stanley
People and Society
In Falkland Islands, the different Ethnic groups are such that we have: Falkland Islander 48.3%, British 23.1%, St. Helenian 7.5%, Chilean 4.6%, mixed 6%, other 8.5%, unspecified 2% (2016 est.)
| Population | |
|---|---|
| Pop growth rate | 0.01% (2014 est.) |
| Birth rate | 10.9 births/1,000 population (2012 est.) |
| Death rate | 4.9 deaths/1,000 population (2012 est.) |
| Health expenditure | |
| Physicians Density | |
| Hospital bed Density | |
| Total fertility rate | |
| Gross reproduction rate | |
| Contraceptive prevalence rate | |
| Est married women (ages 15-49) | 47.7% (2016 est.) |
| Literacy | |
| Education expenditures | |
| Net Migration rate | |
| Nationality | Falkland Island | Falkland Islander(s) |
| Languages | English 89%, Spanish 7.7%, other 3.3% (2006 est.) |
| Religions | Christian 57.1%, other 1.6%, none 35.4%, unspecified 6% (2016 est.) |
| Dependency Ratios | |
| Total dependency ratio | 38.4 (2021) |
| Youth dependency ratio | 21.8 (2021) |
| Elderly dependency ratio | 16.6 (2021) |
| Potential support ratio | 6 (2021) |
| Urbanization | |
| Urban population | 79.7% of total population (2023) |
| Rate of urbanization | 0.53% annual rate of change (2020-25 est.) |
| Major urban areas (Pop) | 2,000 STANLEY (capital) (2018). |
| Sex Ratio | |
| Total population | 1.12 male(s)/female (2016 est.) |
| Life Expectancy at birth | |
| Total population | (2017 est.) 77.9 |
| Male | 75.6 |
| Female | 79.6 |
| Drinking Water Sources | |
| Improved: urban | urban: 100% of population (2022 est.) |
| Unimproved: urban | urban: 0% of population (2022 est.) |
| Unimproved: rural | rural: 21.8% of population |
| Sanitation facility acess | |
| Improved: urban | urban: 100% of population (2022 est.) |
| Improved: rural | rural: 100% of population (2022 est.) |
| Improved: total | total: 100% of population (2022 est.) |
| Unimproved: urban | urban: 0% of population (2022 est.) |
| Unimproved: rural | rural: 0% of population (2022 est.) |
| Unimproved: total | total: 0% of population (2022 est.) |
Demographic profile
All Important Facts about Falkland Islands
Want to know more about Falkland Islands? Check all different factbooks for Falkland Islands below.
-
 Falkland Islands Factbook
-
 The Economy of Falkland Islands
-
 Learn about the Government of Falkland Islands
-
 Communication in Falkland Islands
-
 Popular Universities in Falkland Islands
-
 Enerny in Falkland Islands
-
 Transport in Falkland Islands
-
 The Geography and society of Falkland Islands
-
 The Environment of Falkland Islands
-
 Military and security in Falkland Islands