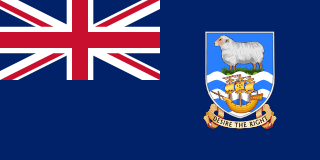
Falkland Islands - Economy

How is the economy of Falkland Islands? Based on the information we have, Falkland Islands has a British South American territorial economy; longstanding fishing industry; surging tourism prior to COVID-19 and Brexit; recent offshore hydrocarbon discoveries threaten ecotourism industries; no central bank and must have British approval on currency shifts. Key agricultural products in this country include: fodder and vegetable crops; venison, sheep, dairy products; fish, squid.
More about the economy of Falkland Islands
| Labor force | |
|---|---|
| Industrial production growth rate | |
| Industries | fish and wool processing; tourism |
| Population below poverty line | |
| Taxes and other revenues | |
| Fiscal year | |
| Exchange rates | |
| Currency | Falkland pounds (FKP) per US dollar - |
| Exchange rates 2024 | 0.78 (2024 est.) |
| Exchange rates 2023 | 0.805 (2023 est.) |
| Exchange rates 2022 | 0.811 (2022 est.) |
| Exchange rates 2021 | 0.727 (2021 est.) |
| Exchange rates 2020 | 0.78 (2020 est.) |
| Budget surplus (+) or deficit (-) | |
| Imports (partners) | UK 68%, Greece 19%, Spain 11%, Netherlands 1%, NZ 0% (2023) |
| Comodities Imports force | refined petroleum, aircraft parts, prefabricated buildings, plastic products, surveying equipment (2023) |
| Exports (partners) | Spain 68%, Morocco 10%, USA 8%, Namibia 3%, Germany 2% (2023) |
| Comodities Exports force | shellfish, fish, wool, sheep and goat meat (2023) |
| GDP (official exchange rate) | $206.4 million (2015 est.) |
| Real GDP Per capita | |
| Real GDP per capita 2015 | $70,800 (2015 est.) |
| Real GDP per capita 2014 | $63,000 (2014 est.) |
All Important Facts about Falkland Islands
Want to know more about Falkland Islands? Check all different factbooks for Falkland Islands below.
-
 Falkland Islands Factbook
-
 The Economy of Falkland Islands
-
 Learn about the Government of Falkland Islands
-
 Communication in Falkland Islands
-
 Popular Universities in Falkland Islands
-
 Enerny in Falkland Islands
-
 Transport in Falkland Islands
-
 The Geography and society of Falkland Islands
-
 The Environment of Falkland Islands
-
 Military and security in Falkland Islands